

Merhabalar; aşağıdaki tradingview kodunu matrix e uyarlamak istedim, ancak tam olarak başarılı olamadım. Yardımcı olabilir misiniz?
//////////Trading View Codes///////////////
SC = input(close, 'Source')
// Fast Trail //
AP1 = input(5, 'Fast ATR period') // ATR Period
AF1 = input(0.5, 'Fast ATR multiplier') // ATR Factor
SL1 = AF1 * ta.atr(AP1) // Stop Loss M:= ATR(Period)
Trail1 = 0.0
iff_1 = SC > nz(Trail1[1], 0) ? SC - SL1 : SC + SL1
iff_2 = SC < nz(Trail1[1], 0) and SC[1] < nz(Trail1[1], 0) ? math.min(nz(Trail1[1], 0), SC + SL1) : iff_1
Trail1 := SC > nz(Trail1[1], 0) and SC[1] > nz(Trail1[1], 0) ? math.max(nz(Trail1[1], 0), SC - SL1) : iff_2
// Slow Trail //
AP2 = input(10, 'Slow ATR period') // ATR Period
AF2 = input.float(3, 'Slow ATR multiplier') // ATR Factor
SL2 = AF2 * ta.atr(AP2) // Stop Loss
Trail2 = 0.0
iff_3 = SC > nz(Trail2[1], 0) ? SC - SL2 : SC + SL2
iff_4 = SC < nz(Trail2[1], 0) and SC[1] < nz(Trail2[1], 0) ? math.min(nz(Trail2[1], 0), SC + SL2) : iff_3
Trail2 := SC > nz(Trail2[1], 0) and SC[1] > nz(Trail2[1], 0) ? math.max(nz(Trail2[1], 0), SC - SL2) : iff_4
// Bar color for trade signal //
Green = Trail1 > Trail2 and close > Trail2 and low > Trail2
Blue = Trail1 > Trail2 and close > Trail2 and low < Trail2
Red = Trail2 > Trail1 and close < Trail2 and high < Trail2
Yellow = Trail2 > Trail1 and close < Trail2 and high > Trail2
// Signals //
Bull = ta.barssince(Green) < ta.barssince(Red)
Bear = ta.barssince(Red) < ta.barssince(Green)
Buy = ta.crossover(Trail1, Trail2)
Sell = ta.crossunder(Trail1, Trail2)
TS1 = plot(Trail1, 'Fast Trail', style=plot.style_line, color=Trail1 > Trail2 ? color.blue : color.yellow, linewidth=2, display=display.none)
TS2 = plot(Trail2, 'Slow Trail', style=plot.style_line, color=Trail1 > Trail2 ? color.green : color.red, linewidth=2)
fill(TS1, TS2, Bull ? color.new(color.green, 90) : color.new(color.red, 90))
plotbuysell = input(true, 'Plot Buy/Sell arrows')
plotshape(Buy and plotbuysell == 1, 'BUY', shape.labelup, location.belowbar, color.new(color.green, 0), text='BUY', textcolor=color.new(color.black, 0))
plotshape(Sell and plotbuysell == 1, 'SELL', shape.labeldown, location.abovebar, color.new(color.red, 0), text='SELL', textcolor=color.new(color.black, 0))
Tradingview algoritmasının matrix diline çevrimi
- Soruldu
- Görüntülenme
- 891 görüntülenme
- Durum
- Cevaplandı
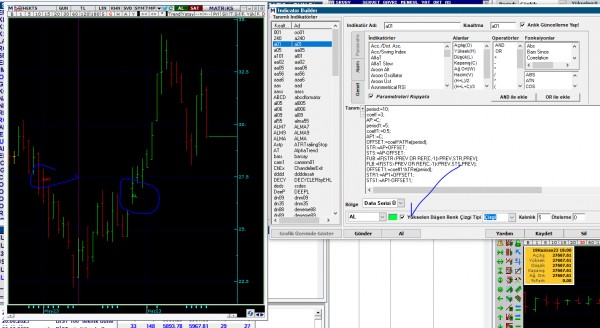

Bir sorum daha olacak;
al geldiğinde grafik üzerinde "AL", sat geldiğinde "SAT" yazamadım.
TextOut(CROSS(Trail1, Trail2),"AL", D);
TextOut(CROSS(Trail2, Trail1),"SAT", U)
kullandım ama bu istediğimi değil de indikatöre verdiğim ismi yazıyor.